
Matterport Inc. (MTTR)
When it comes to advanced technologies that can create a 3D map of the inside of any building.
Kind of like those high tech spy movies we watch in the cinemas.
Undoubtedly, the first company that comes to mind is Matterport Inc.
Matterport Inc. is a technology company that provides a platform to capture, store, share, and experience 3D images and models.
It recently went public via the SPAC route earlier this year in 2021.
Industry Leader
Hands down, Matterport Inc. (MTTR) is the best in the 3D imaging business.
Why?
Simply because they don’t really have much competitors in the 3D imaging industry.
They claim they have over 100 times the market share of all their competitors combined.
Statistically, that is true since the nearest competition is almost insignificant.
To cut the story short, Matterport is pretty much the pioneer in this market with the rest of the pack virtually chasing after its shadow.
Growing Clientele
A lot of Fortune 500 companies are Matterport users.
MTTR have partnered with Redfin and Zillow to provide 3D tours for their listings.
As well as Airbnb to provide insight views of the properties for them.
Currently, they have an estimated 250,000 subscribers and 150 companies around the world.
That is about 18 times as many as they did have two years ago.
Huge Potential For Future Growth
Without the shadow of a doubt, Matterport Inc. is growing at a accelerated pace.
And this 3D trend is really catching on especially with the evolution of the “Metaverse” by Mark Zuckerberg.
If the vision of the Metaverse plays out as forecasted, then 3D imaging should logically have a larger “Supporting” role in the 3D virtual space, correct?
Matterport Inc. (MTTR) Elliott Wave Analysis
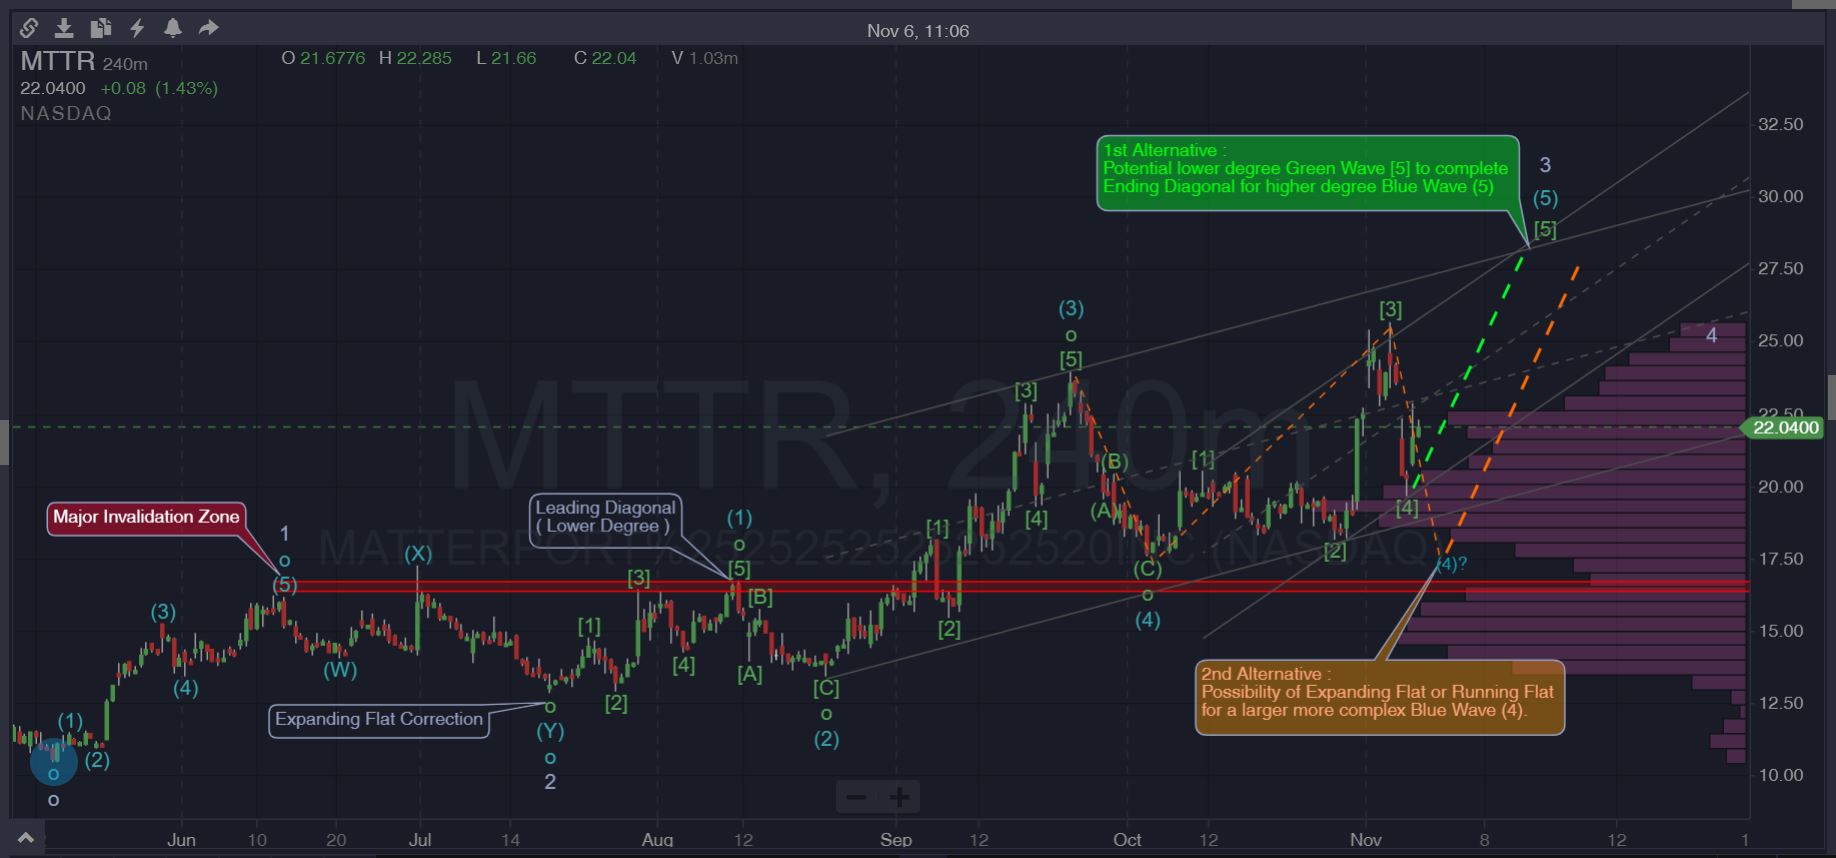
Since the chart data on this emerging stock is pretty limited, our blog’s Elliott Wave Analysis is currently anticipating the completion of Wave 3 in White.
This could potentially happen in one of 2 ways.
My 1st alternative is shown by the Lime Green dotted lines.
If the Wave (5) in Blue is forming an “Ending Diagonal” as anticipated.
Then, the likelihood of the current price trajectory rallying higher is highly plausible.
Alternatively
My 2nd alternative is shown by the Orange dotted lines.
If the Wave (4) in Blue has not completed as initially forecasted.
And is currently in the midst of forming a much larger 3-3-5 corrective structure.
Then, we can anticipate another drop from current prices before the Blue 5th wave in the lower degree can commence.
How much further MTTR will drop will depend on whether this corrective structure will play out as an “Expanding Flat” or a “Running Flat”.
The Bottom Line
According to the Elliott Wave Principles’ Rule where Wave 4 cannot retrace into the price region of Wave 1.
We have an “Invalidation Zone” at around the $16.50 region as shown by the Red Horizontal bar.
This is the common support zone for both the peak of Wave 1 in White in the higher degree as well as Wave (1) in Blue in the lower degree.
Share Your Views
How many of fellow traders agree with me on the Matterport Inc. (MTTR) Elliott Wave Analysis ?
Let me know your thoughts on whether this stock will be the “Next” best performing supporting stock for the upcoming Metaverse playbook.
Do share your thoughts on this …
Note that this is not financial advice, just my humble opinion.
For more potential trade setup suggestions on the US Stock Markets, check our Blog Posts On US Stocks.
Shorten your learning curve by downloading our complimentary “Elliott Wave Cheat Sheets”.
For more articles on the Elliott Wave Principle, check out our other posts in our Elliott Wave Blog.