
NIO Elliott Wave Analysis
The Chinese EV market can be so volatile and fickle minded at times.
Seems like any bit of bad news can spook market sentiments.
Since NIO’s ATH at $61.95 in early 2021, subsequent rallies has often fizzled out at the last minute.
Sometimes, the safest bet as a trader might just be to sit on your hands.
And do absolutely nothing until a high probability setup comes knocking on your door.
Gloomy Fundamentals
From a fundamental perspective, mounting global supply chain constraints.
As well as excessive scrutiny by Chinese regulators on US traded stocks are not brooding well for the Chinese EV players.
In addition, any news coming from EV industry leader Tesla is also constantly on the back of investor’s minds.
Elon Musk’s recent offloading of $10 billion worth of shares for “Supposing” tax reasons seems to have rattled the overall EV market in one way or another.
And apparently, all these factors combined are doing no favours for Chinese EV players like NIO Inc.

Can The Support Zone Still Hold?
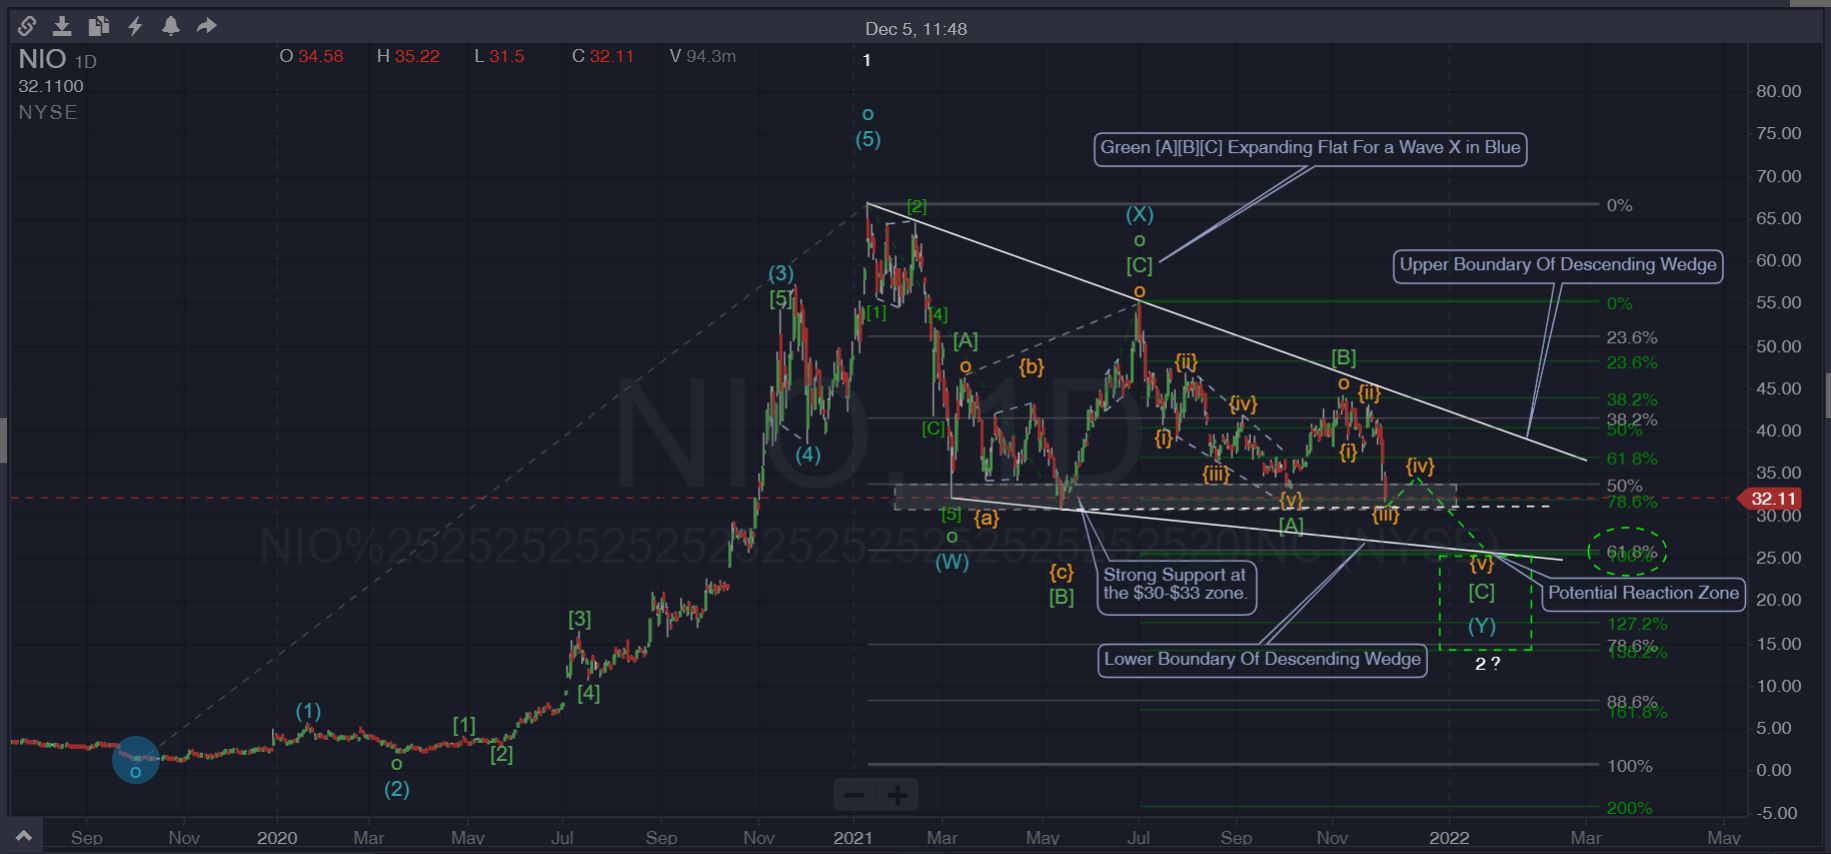
Structure wise, there seems to be strong support at the $30 to $33 zone for NIO.
With this support zone being tested multiple times since the beginning of the year.
However, the recent downward pressure on the EV industry is seemingly close to pushing NIO over the edge.
Potential Descending Wedge Scenario
From a charting perspective, we are anticipating the possible completion of a descending wedge pattern.
Previous NIO rallies has failed to break above the upper boundary of the proposed descending wedge downtrend line.
While the current price action seems to indicate a high possibility for another leg down.
Possibly breaking the strong existing support zone and touching the lower boundary of the descending wedge pattern.
Complex Corrective Structure
Our latest NIO Elliott Wave Analysis seem to concur with the chart analysis.
From an EW perspective, we are anticipating a (W)(X)(Y) corrective structure in Blue to play out.
This is to potentially complete the Wave 2 in White in the larger Primary degree.
Currently, we are in the midst of the lower degree [C] leg in Green of the higher degree (Y) leg in Blue.
If the current wave count is correct, it looks like the recent drop can be regarded as Wave {iii} in Orange in the lower degree.
The existing support zone may provide the necessary initial resistance for a Wave {iv} correction in Orange.
Before finally succumbing to overall market pressures for the final Wave {v} in Orange to complete larger Primary Wave 2 in White.
Although this might just be an Elliott Wave forecast going forward.
But I reckon it has a high probability of playing out.
Confluence Zone
Looking at the charts, the potential completion of the Primary Wave 2 in White just happens to be in the Fibonacci retracement zone of 50% to 61.8% of the prior ATH.
Which is also likely to be in close proximity to the lower boundary of the descending wedge pattern.
Signaling a possible bounce off the lower boundary line.
In addition, the 100% Fibonacci Extension (1 is to 1 ) of the [A][B][C] Zig Zag in Green also just happens to be at these same price levels.
With so much “Confluence” at this zone, I am expecting an potential reaction around these levels, highlighted by the Green Dotted Box.

Possible Entry Zones
The potential break below the critical $30 support zone might be seen as “Bad” news to most.
But like what Warren Buffett once said, “When there’s blood in the streets, you buy”.
For aggressive investors with deep pockets and a long term view of the EV industry , it might just be the right opportunity to grab a beaten down stock at a good price.
But for conservative traders looking for shorter term gains, a convincing break above of the upper boundary down trendline of the descending wedge might be a safer option to pursue.
Summary
As a strong advocate of the EV industry, I am more inclined towards NIO’s share price eventually treading higher in the near future.
And if NIO drops lower into the Green Dotted Box zone with a reversal candlestick pattern on the daily or weekly chart, I am a long term bull.
Simply put, time to grab the low-hanging fruit.
Kindly note that this is not financial advice, just my humble opinion.
Share Your Views
How many of my fellow traders agree with me on my NIO Elliott Wave Analysis ?
Do comment and share your thoughts in the comments box.
Trade Safe and Prosper.
For more potential trade setup suggestions on the US Stock Markets, check our Blog Posts On US Stocks.
Shorten your learning curve by downloading our complimentary “Elliott Wave Cheat Sheets”.
For more articles on the Elliott Wave Principle, check out our other posts in our Elliott Wave Blog.