
OVERVIEW
Raffles Medical Group (BSL) was once considered the “Blue Chip” healthcare stock in Singapore.
Apparently, that was the “Previous” view a couple of years ago.
That was way before Raffles Medical Group decided to expand overseas.
And venture in the massive China markets.
When COVID hit our shores early last year, many investors are betting on this Healthcare stock to rise to the occasion.
Well, things did not quite turn out as expected, did it?
But at least for now BSL share prices seems to seeing some signs of a recovery.
RAFFLES MEDICAL GROUP ELLIOTT WAVE CHART ANALYSIS
Based on our blog’s Raffles Medical Group Elliott Wave Chart Analysis.
We might be seeing a reversal in fortunes for BSL’s share price following it recent euphoric rise in the short term.
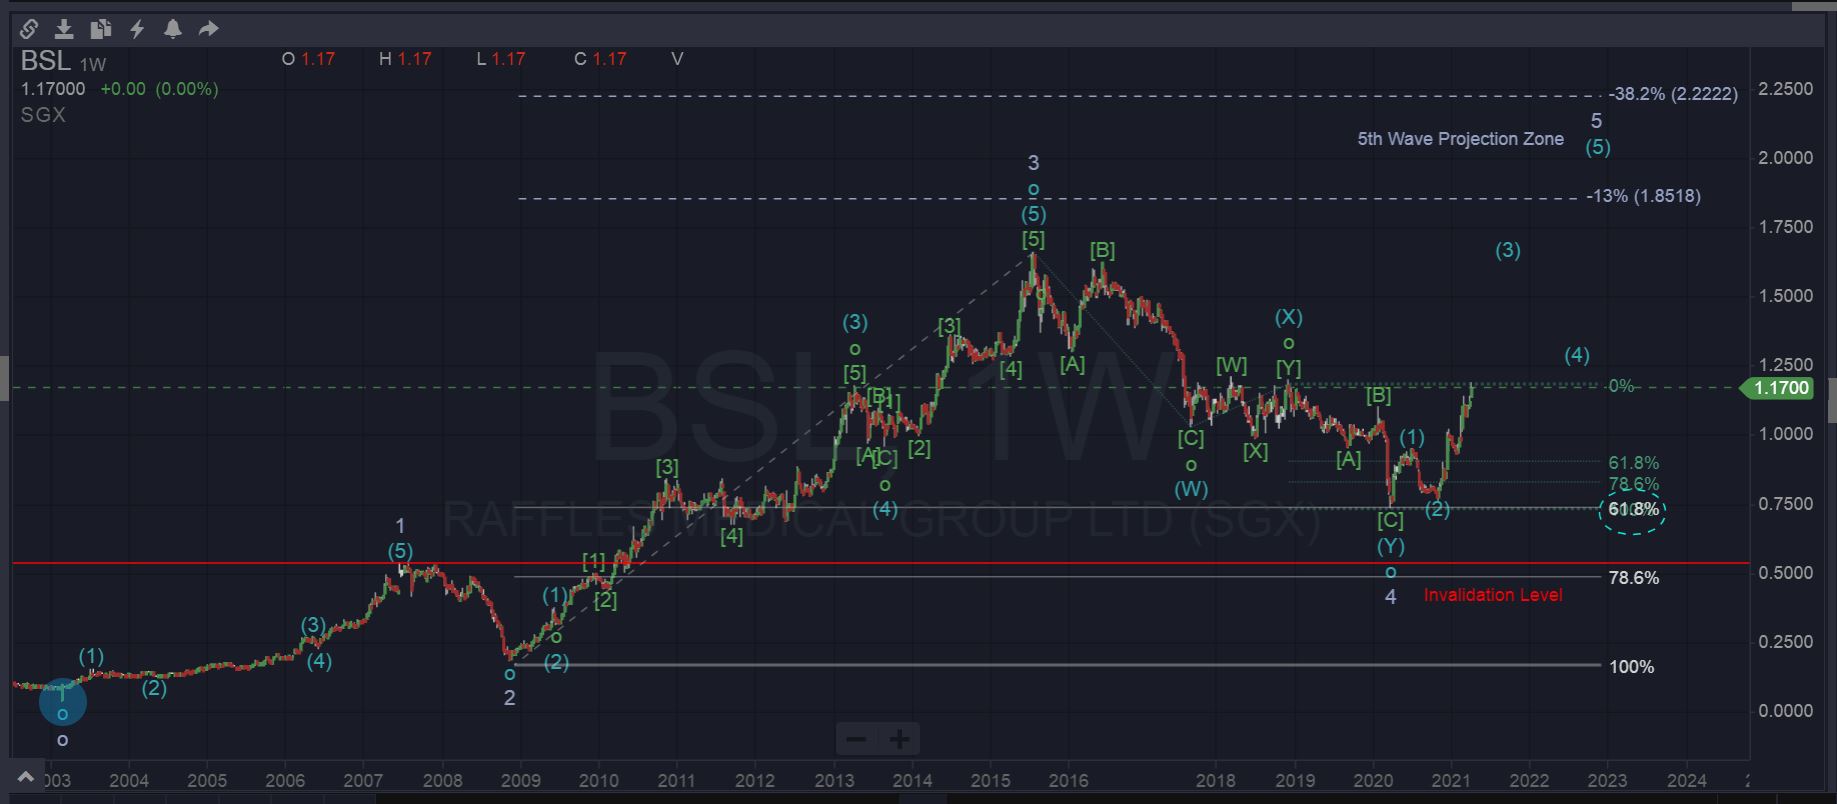
Let us just focus on the the 4th wave (W)(X)(Y) “Corrective” phase in Blue that begin in late 2015 after reaching its all time high at $1.65.
Initially, the first phase of this corrective structure seemingly unfolded in an [A][B][C] Zig-Zag fashion in Green.
With BSL share price dropping all the way down to the $1 psychological support level.
PERSONALLY VESTED
I still vividly recall putting a Buy Order for this stock in late 2017.
The decision was based purely on my Raffles Medical Group Elliott Wave Chart Analysis at that time.
But boy was I in for the ride.
But apparently in the wrong direction as I wasn’t expected an extended double correction.
DOUBLE CORRECTIVE STRUCTURE
BSL share prices started to consolidate and ended up making a [W][X][Y] in Green.
Forming the (X) leg in Blue of the larger degree.
Troubled by the global chaos caused by the COVID pandemic as well as the high operating costs of its China based hospitals.
BSL share price made another steep leg down in the form of an [A][B][C] in Green.
Completing the (Y) Leg in Blue of the larger degree.
Technically forming a larger Double Corrective Structure in the form of an (W)(X)(Y) in Blue.
Which makes up the Wave 4 in White of the larger degree.
FIBONACCI CONFLUENCE
From a Raffles Medical Group Elliott Wave Chart Analysis perspective, this could pose a valid Buy trade.
And if you delve deeper into the BSL chart using Fibonacci Analysis.
You would have noticed that a significant Fibonacci “Confluence” zone is brewing.
At around those price levels, we noticed the following observations.
It is incidentally around the Golden Fibonacci Ratio zone of 61.8% of the previous 3rd wave impulse.
As well as the 100% Fibonacci Extension projections of the larger (W)(X)(Y) corrective structure in Blue.
Refer to the confluence zone highlighted by the dotted oval shape in Cyan at around $.076
MISSED BUYING OPPORTUNITY
Even though Raffles Medical Group Elliott Wave Chart Analysis clearly showed a potential buying opportunity.
But with the COVID situation running rampant and major cities still in lockdown mode.
I was quite hesitant to add new positions at around the those levels.
My thoughts at that moment was that it could further escalate into a potential (W)(X)(Y)(X)(Z) 11 wave swing based on the way the COVID pandemic was spreading across the globe.
But it was clearly a “Missed” opportunity on hindsight.
POTENTIAL RECOVERY PHASE
Our Raffles Medical Group Elliott Wave Chart Analysis for this week is currently showing a continuation of a 5 wave sequence in Blue.
The current rise in BSL share price has gone beyond the Fibonacci 161.8% projection levels of the motive wave labelled (1) in blue.
This means that the probability of a viewing it as an (A)(B)(C) corrective structure for an additional (X) corrective leg in the larger degree is greatly diminished.
The impending forecast is for BSL to continue its 5 wave sequence in Blue upwards to form the larger 5th wave in White.
The horizontal Red Line represents the “Invalidation Level” .
It is based the standard Elliott Wave Rule where Wave 4 cannot retrace into the price region of Wave 1 in White.
Based on the Fibonacci projection levels, we are expecting the 5the wave in White to at least break the previous ATH.
And technically go higher to within the Fibonacci projection levels 1.13% to 1.38% levels.
Trade Safe and never risk more than 1% to 2% of your account equity on any trades.
For more potential trade setup suggestions on the US Stock Markets, check our Blog Posts On US Stocks.
Shorten your learning curve by downloading our complimentary Elliott Wave Cheat Sheets.
For more articles on the Elliott Wave Principle, check out our other posts in our Elliott Wave Blog.