
Brief History
Before we begin our FASTLY Elliott Wave Analysis.
For those who are not too familiar with Fastly Inc (NYSE : FSLY), here’s a short and quick introduction.
Essentially, Fastly Inc. operates an edge cloud platform for processing and securing it’s client’s data and applications.
Its wide customer base includes clients in the digital publishing, media and entertainment, online retail, travel and hospitality as well as the financial technology sectors.
A little side trivia before we begin . . .
Did you know that this company was formerly known as SkyCache Inc. before changing its name to Fastly Inc. in May 2012.
FASTLY Fundamental Analysis Perspective
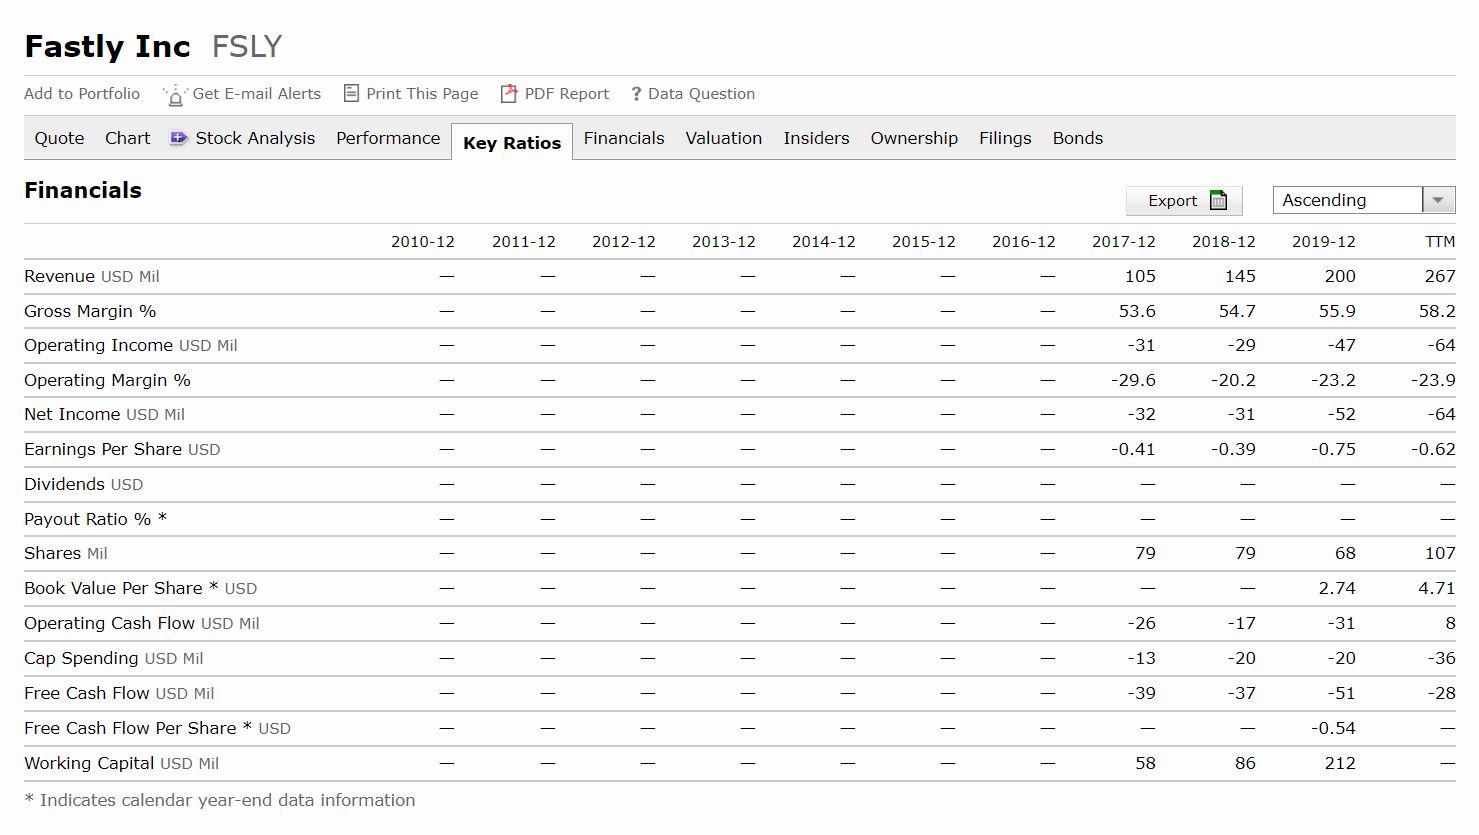
A quick glance at the Financial Key Ratios from Morningstar.com reveals some insights into this cloud computing company.
For most startups which are still bleeding cash in the initial stages of growth, the best guide is to look at the Price To Sales Ratio (P/S)
For a cutting edge growth company in the fast growing cloud computing sector, FLSY’s P/S ratio for the last 3 years are as follows :
- The highest P/S was 46.93.
- The median P/S was 10.59.
- The lowest P/S was 5.41.
Potential Cause For Concern
After sieving through the data, I noticed that its EPS as well as its operating margin have both declined over the last year.
This might be of some concern going forward.
Nevertheless, the rapid rise of FSLY has been nothing short of a phenomenon by any means.
However, as the saying goes, “The higher you climb, the harder you fall.”
Since its All Time High (ATH) level of $136.50 on the 13th Oct 2020, Fastly’s share price took a nose dive after announcements of a guidance cut.
This might be attributable to both increasing competition in the cloud computing space.
As well as inherent geopolitical problems with its existing customers base.
Especially pertaining to the unstable situation surrounding its largest customer ByteDance, the Chinese owner of social media sensation TikTok.
FASTLY Elliott Wave Analysis Perspective
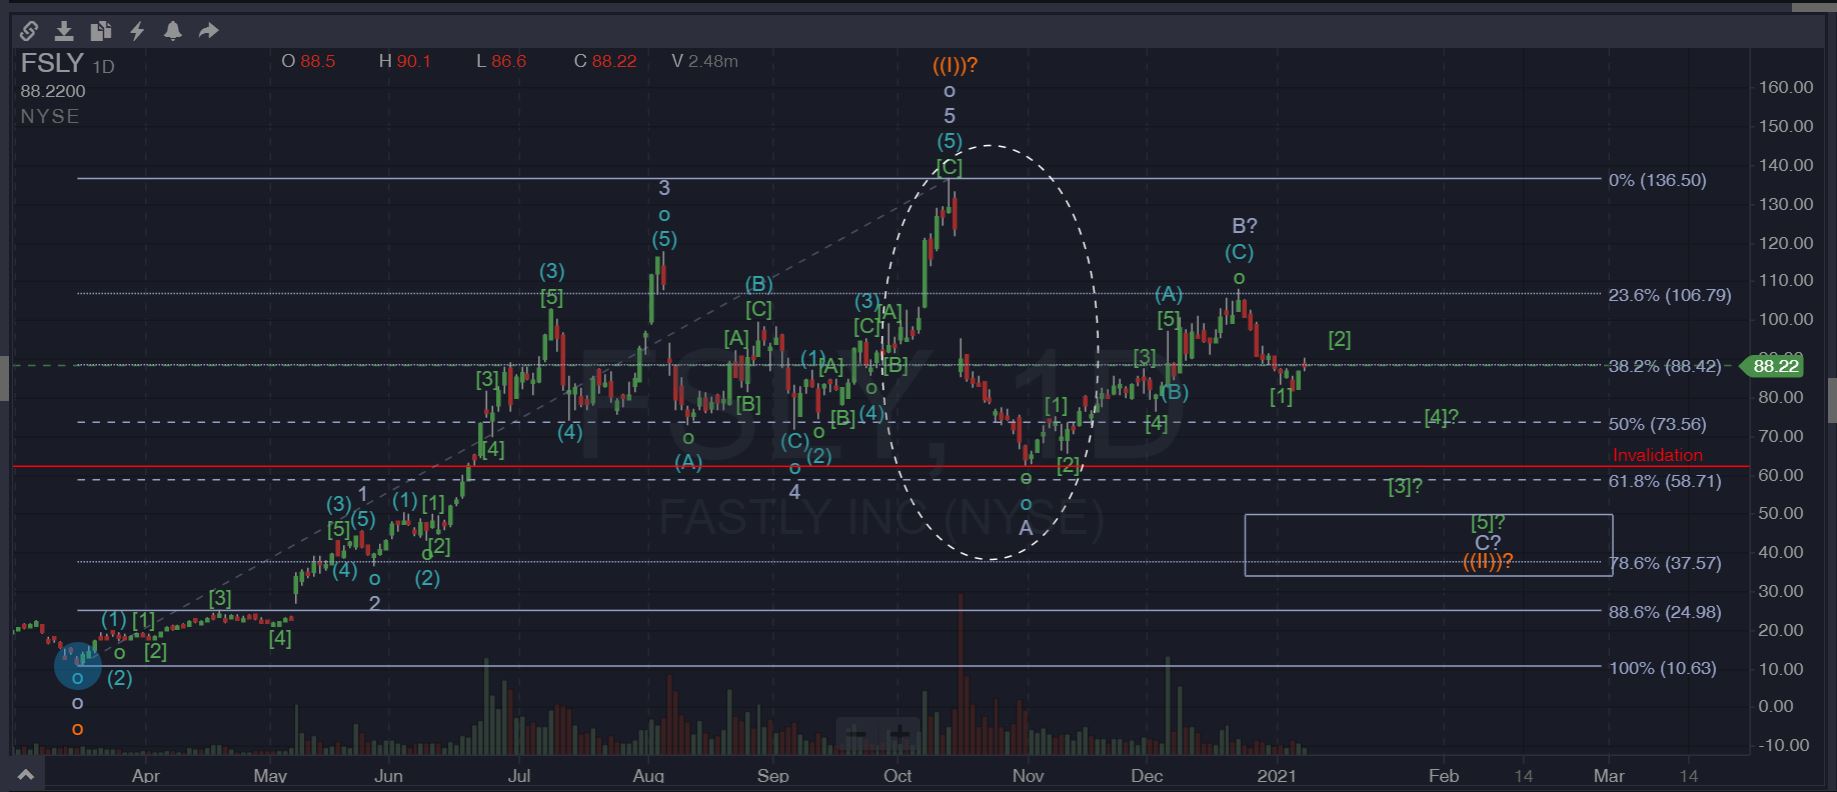
Looking at the Elliott Wave Chart of FASTLY shown above.
Since its listing till its ATH on 13th Oct 2020, the FASTLY Elliott Wave Analysis apparently showed that it has completed a 1-2-3-4-5 impulsive move up to complete the larger wave ((I)) in orange.
Some might argue that Wave 1 in white might be overly extended.
But I reckon that is generally acceptable since the Elliott Wave counts in the lower degree does adhere to the Standard Elliott Wave Rules & Guidelines.
Since cloud computing was all the rage a couple of years ago, a shallow Wave 2 corrective structure in white certainly came as no surprise.
And with any red hot trends in the tech computing space, the FASTLY Elliott Wave Analysis for Wave 3 in white generally tends to be overly extended.
This larger Wave 3 in white can be broken down into another nested 5 wave sequence in the lower degree in blue.
This is followed internally by another nested Wave 3 in green.
In accordance to the Elliott Wave Principle’s Rule Of Alternation.
If Wave 2 is “Shallow”, then Wave 4 generally tends to be “Complex” & vice versa.
Although this is just a “Guide” and not a hard and fast rule, it seems to have played out relatively nicely on the FASTLY Elliott Wave Analysis.
From the charts, we can tell that Wave 4 in white seemingly played out in text book style into a deeper A-B-C correction.
This complex Wave 4 correction in white has a relatively short C-leg.
The short C-Leg just manages to pierce the Fibonacci Extension levels of 61.8% before continuing higher for the last Wave 5 in White.
The FASTLY Elliott Wave Analysis for Wave 5 was almost parabolic in nature, reaching an unprecedented ATH at $136.50 as mentioned earlier.
Depth Of Corrective Structure
We all know what happened after that impending unsustainable euphoric rise of FASTLY.
FASTLY’s share price reportedly took a sharp nose dive with a massive “Gap Down” chart structure after announcing a guidance cut.
Within a short time span, FASTLY’s share price dropped to an alarming $62 level as shown by the horizontal red line.
Some traders I know feel that this steep drop is all the correction required for this red hot stock to continue its upward trajectory.
And they argued that the corresponding price rally that followed suit is proof of that.
However, I beg to differ.
My Observations
In my opinion, this massive drop from its peak highlighted by the white dotted oval can likely be viewed as a 5 wave sequence due to it impulsive nature.
There is no other possible scenarios where I can count it as a 3 wave correction no matter how many times I look at it.
From my FASTLY Elliott Wave Analysis, I am inclined to label the sharp drop as a Wave A in white of the larger A-B-C correction.
The end of this A-B-C correction in white will ultimately form the larger degree Wave ((II)) in orange.
As for the so-called follow up relief rally a lot of my trader friends referred to, I am viewing it as the B-leg correction in white for 3 reasons.
Firstly, this B-leg rally apparently loses momentum and reverses right at the Golden Fibonacci Retracement level of 61.8% of the prior A-leg in white.
Secondly, if you go down into the lower time frames, the Elliott Wave counts for the B-Leg does correspond to a 5-3-5 A-B-C corrective structure in blue.
Thirdly, If you pull out the Fibonacci Extension tool, this relief rally apparently makes a U-turn at the typical Fibonacci Extension Zone of 100% to 1.272% zone.
FYI, this Fibonacci Extension zone is a common target zone for reversals.
My Expectations
From my FASTLY Elliott Wave Analysis, all paths seems to point “SOUTH” with further weakness in the FASTLY share price.
I am viewing Wave A in white as an impulsive 5 wave sequence largely due to the “Gap-Down” situation.
And have counted Wave B in white as a 3 wave connector.
Naturally, my inclination for Wave C is for it to be potentially another 5 wave sequence for an Ending Diagonal to complete the overall larger corrective structure for a Wave ((II)) in orange.
The million dollar question is how far and deep will this C-Leg be?
In the worst case scenario, I am expecting FLSY’s share price to drop to the $40 to $50 zone.
This forecast is based on the typical Fibonacci Extension zones of 100% to 127.2% for high probability reversal targets.
Coincidentally, this zone also falls within the confluence zone for the 78.6% Fibonacci Retracement level of the prior meteoric rise of FSLY.
If you are into Harmonic Patterns, this also presents a situation for a Bullish Harmonic Gartley pattern.
In the best case scenario, it is not uncommon to have the C-Leg as a relatively short leg.
It has becoming more prevalent nowadays for the short C-Leg to just drop to the Fibonacci Extension zone of 61.8% and reverse to complete the overall correction.
Alternative View
As always, there are 2 sides to a coin.
And as a Elliott Wave practitioner, we should always be open to alternatives as the “Market Is Always Right” no matter what we think or believe.
That is why I have drawn the horizontal red line at the $62 level as my “Invalidation” line.
In the scenario where the markets are extremely bullish and I have totally misread the FASTLY Elliott Wave Analysis.
Then the B-Leg that I have labeled might just be the start of a new Wave 1.
And the current impending correction is the new Wave 2 correction for another strong push up.
If that is the case, I would NOT expect FSLY share price to drop below the red invalidation line in accordance to Elliott Wave Principle’s First Rule.
Which specifically states that Wave 2 cannot retrace more than 100% of Wave 1.
Hope all that makes sense.
Trade Safe and never risk more than 1% to 2% of your account equity on any trades.
For more potential trade setup suggestions on the US Stock Markets, check our Blog Posts On US Stocks.
Shorten your learning curve by downloading our complimentary Elliott Wave Cheat Sheets.
For more articles on the Elliott Wave Principle, check out our other posts in our Elliott Wave Blog.