
OVERVIEW
For this week’s blog, we will look at our Mapletree Industrial Trust Forecast using the Elliott Wave Principle.
For those who are not not familiar with one of the most popular Singapore REITs, here a quick introduction.
Mapletree Industrial Trust (SGX : ME8U) a.k.a MIT is a Real Estate Investment Trust (REIT) listed on the Main Board of Singapore Exchange.
MIT’s primary investment strategy is to invest in a diversified portfolio of income-producing real estate used primarily for industrial purposes in Singapore.
It also invests in income-producing real estate used primarily as “Data Centres” globally.
As well as other miscellaneous real estate-related assets.
In a nut shell, MIT’s property portfolio comprises of 85 industrial properties in Singapore.
These includes the following :
- Hi-Tech Buildings
- Flatted Factories
- Business Park Buildings
- Stack-up/Ramp-up Buildings
- Light Industrial Buildings
MIT also invested in 14 Data Centres in the United States of America.
With a 40% interest through the joint venture with Mapletree Investments Pte Ltd.
BRIEF FUNDAMENTAL ANALYSIS
For our Mapletree Industrial Trust Forecast, we will focus more on the Technical Analysis aspect using Elliott Wave Theory.
And will only touch on certain key fundamental data that supports our stock selection.
Besides a sustainable Economic Moat as well as a Proven Managements Team as the main 2 criteria for any REIT selection.
We also look at 3 basic fundamental data in order to gauge whether a certain REIT is a good long term investment.
To cut a long story short, we namely look for the following 3 criterias :
(A) Growing DPU :
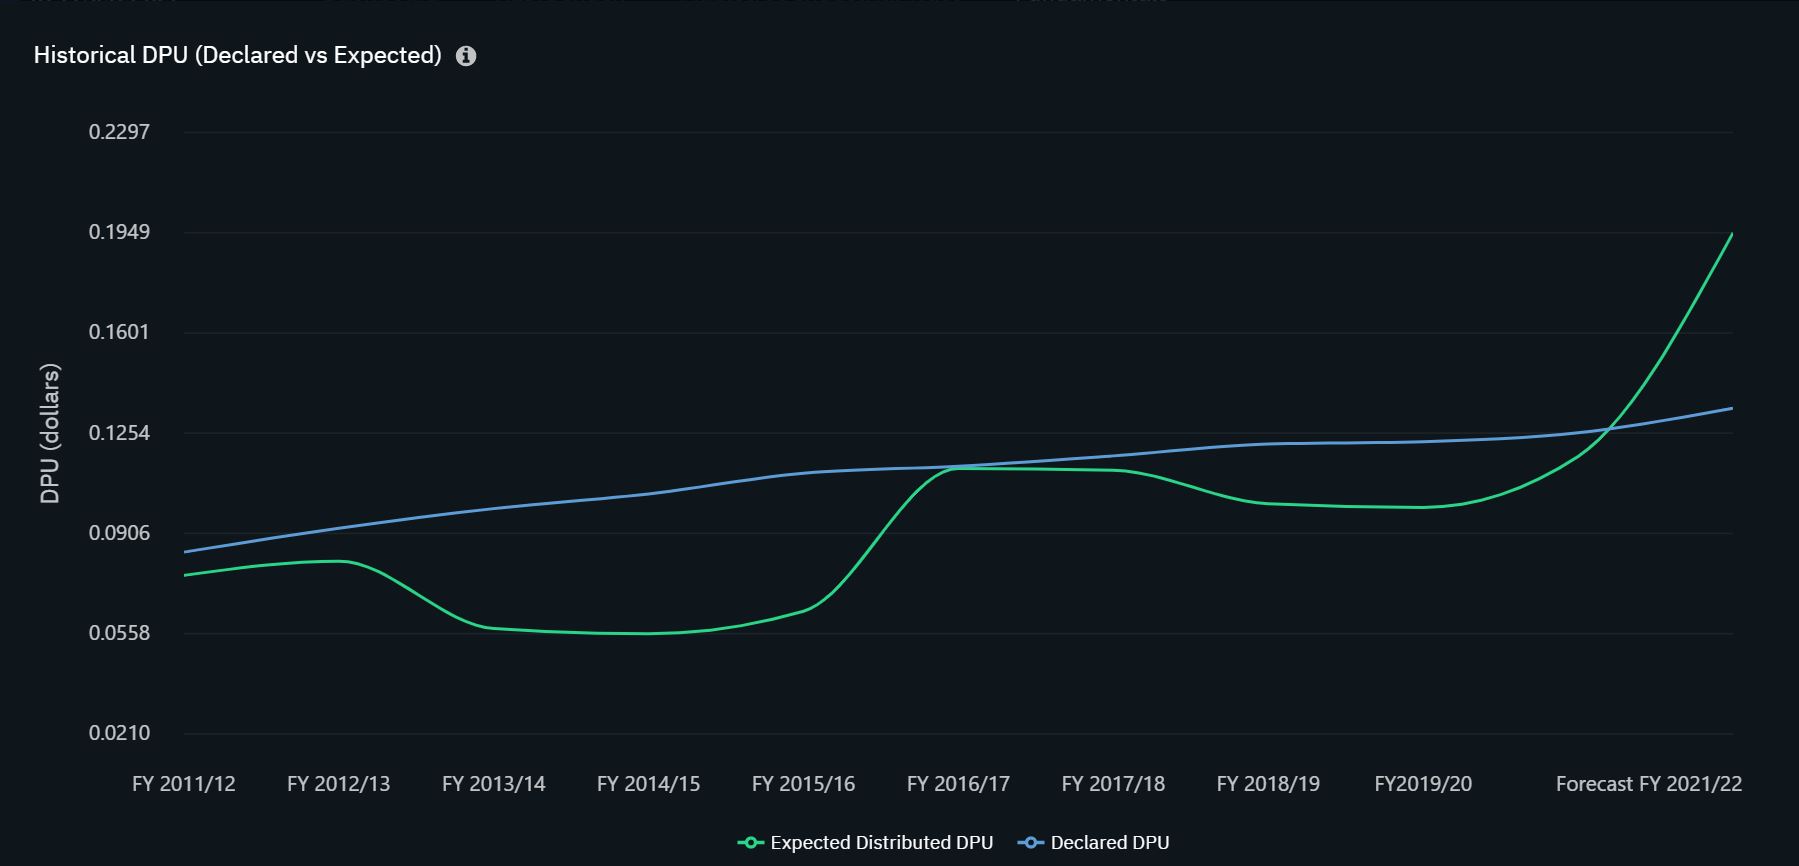
One of the key criteria for any REIT selection is at least 3 to 5 years of continual DPU growth.
No issues here as MIT has grown its DPU steadily over the last decade.
(B) Growing NAV :
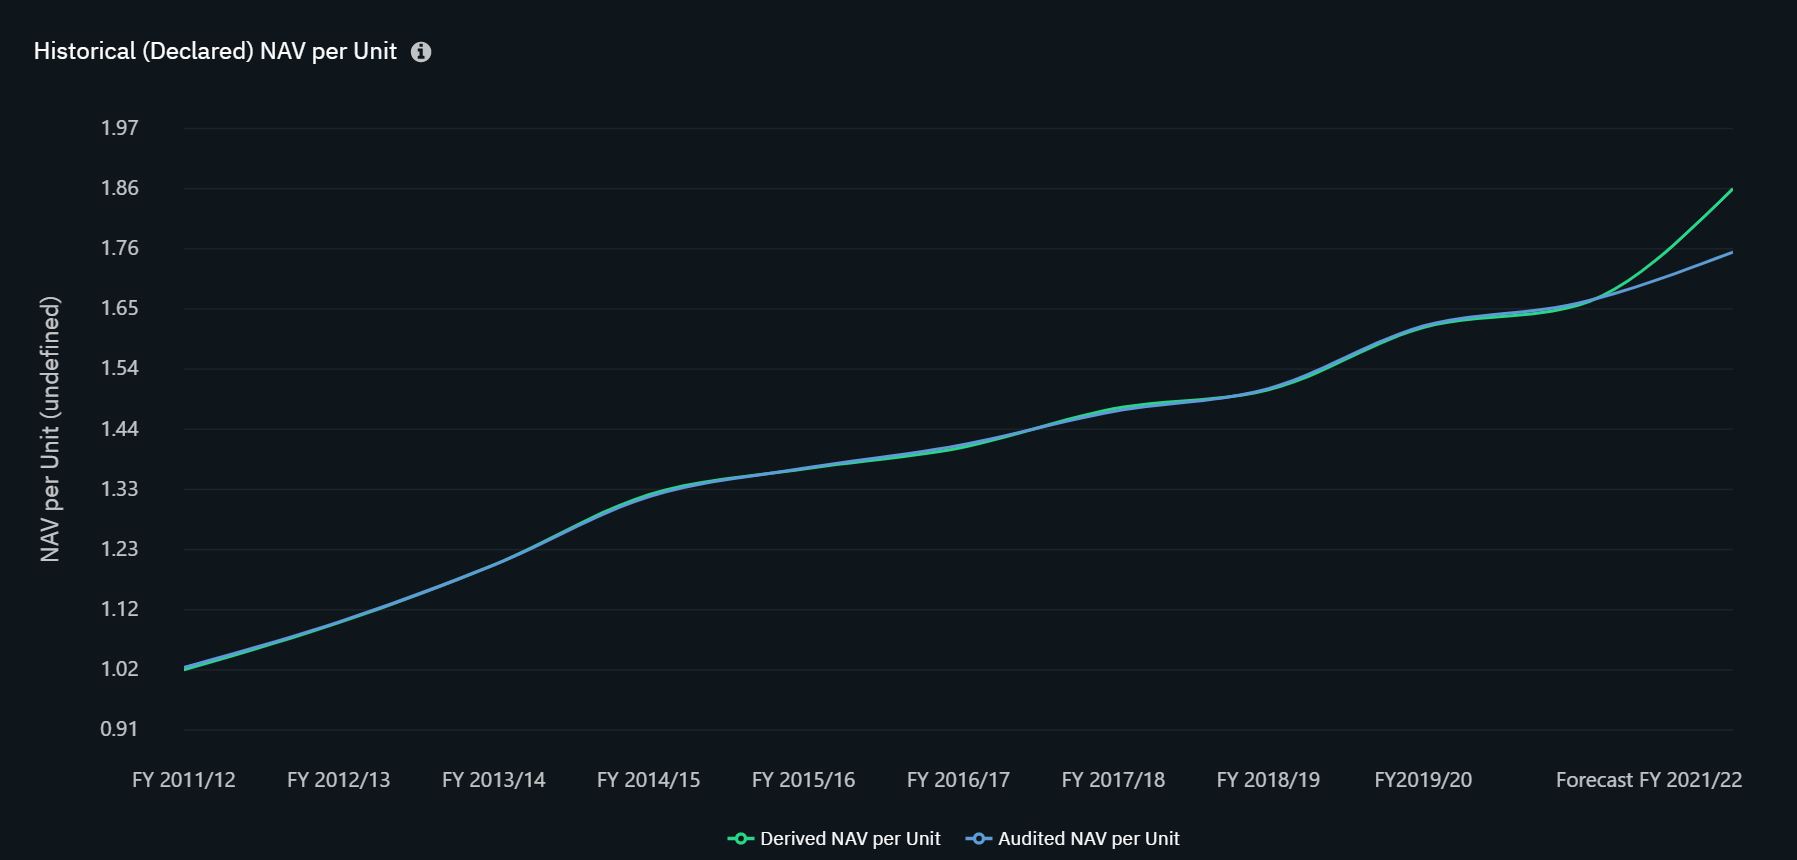
Another key criteria for any REIT selection is at least 3 to 5 years of continual NAV growth.
Again, no issues here as MIT has grown its NAV at an increasing rate over the last decade.
(C) Sustainable Interest Coverage :
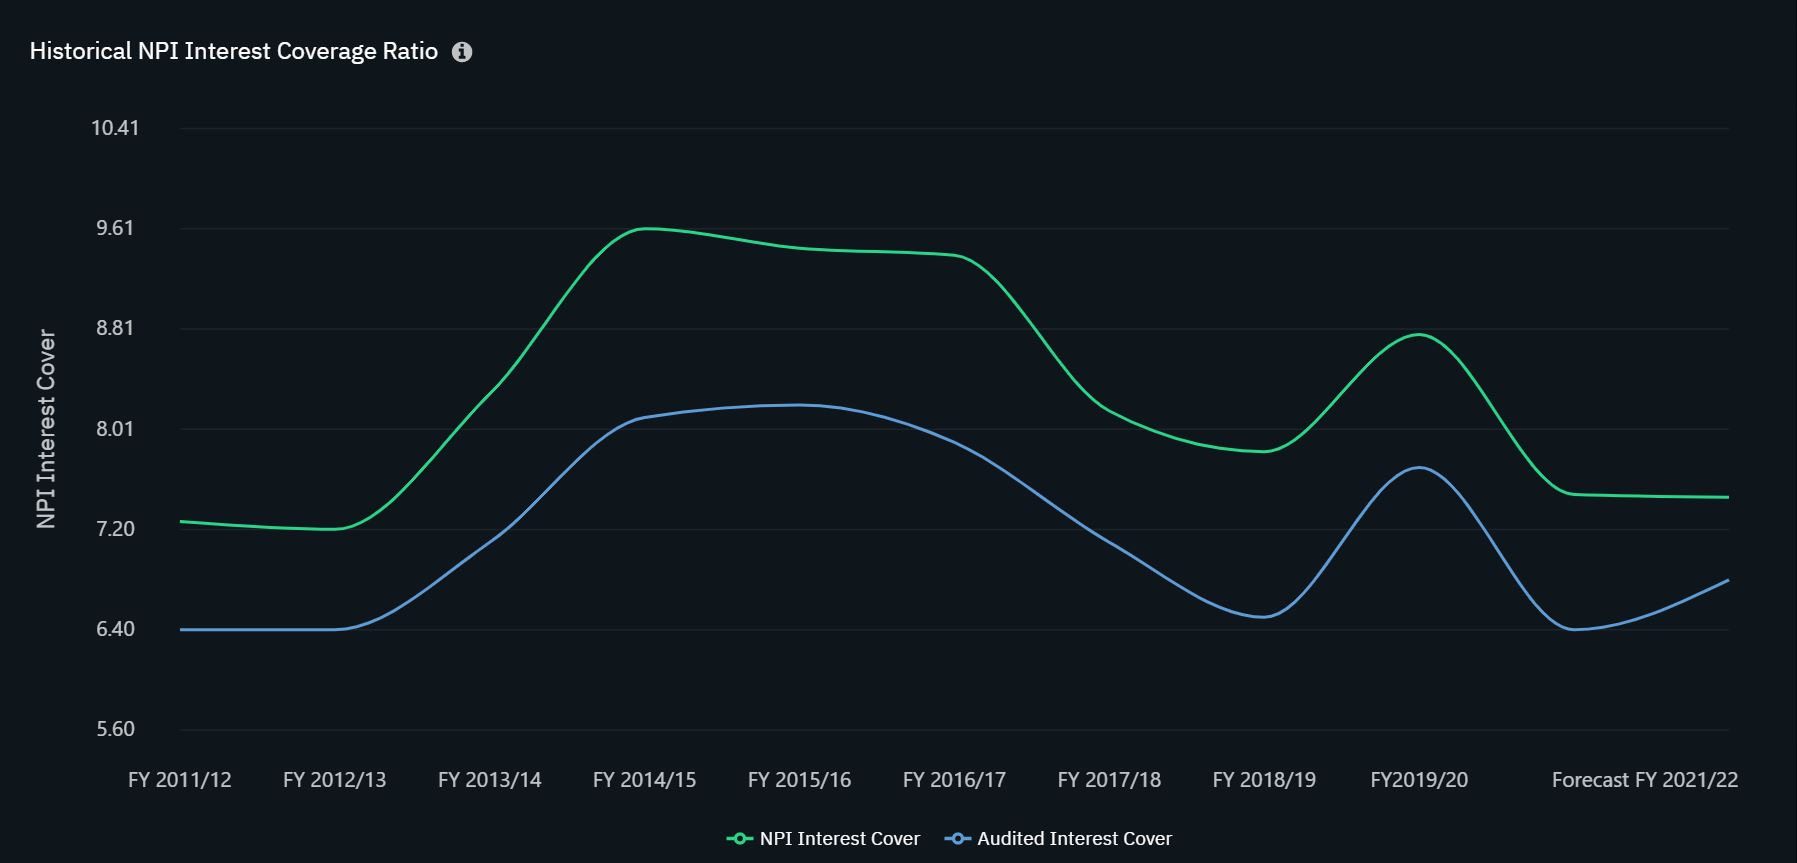
Lastly, our final criteria for any REIT selection is the Interest Coverage Ratio (ICR) to be at least 5 times.
Although the ICR might be fluctuating over the last 10 years, it has never gone below the 5X mark.
A more than satisfactory PASS in my opinion.
TECHNICAL ANALYSIS USING ELLIOTT WAVE PRINCIPLE
According to the Mapletree Industrial Trust Forecast of some of the Elliott Wavers I have spoken to.
It seems that many believe that MIT’s ATH of $3.34 on the 12th Oct 2020 signifies the completion of its Primary Cycle.
And currently, we are in the Corrective Phase of the larger degree.
POSSIBILITY OF AN EXTENDED WAVE 3
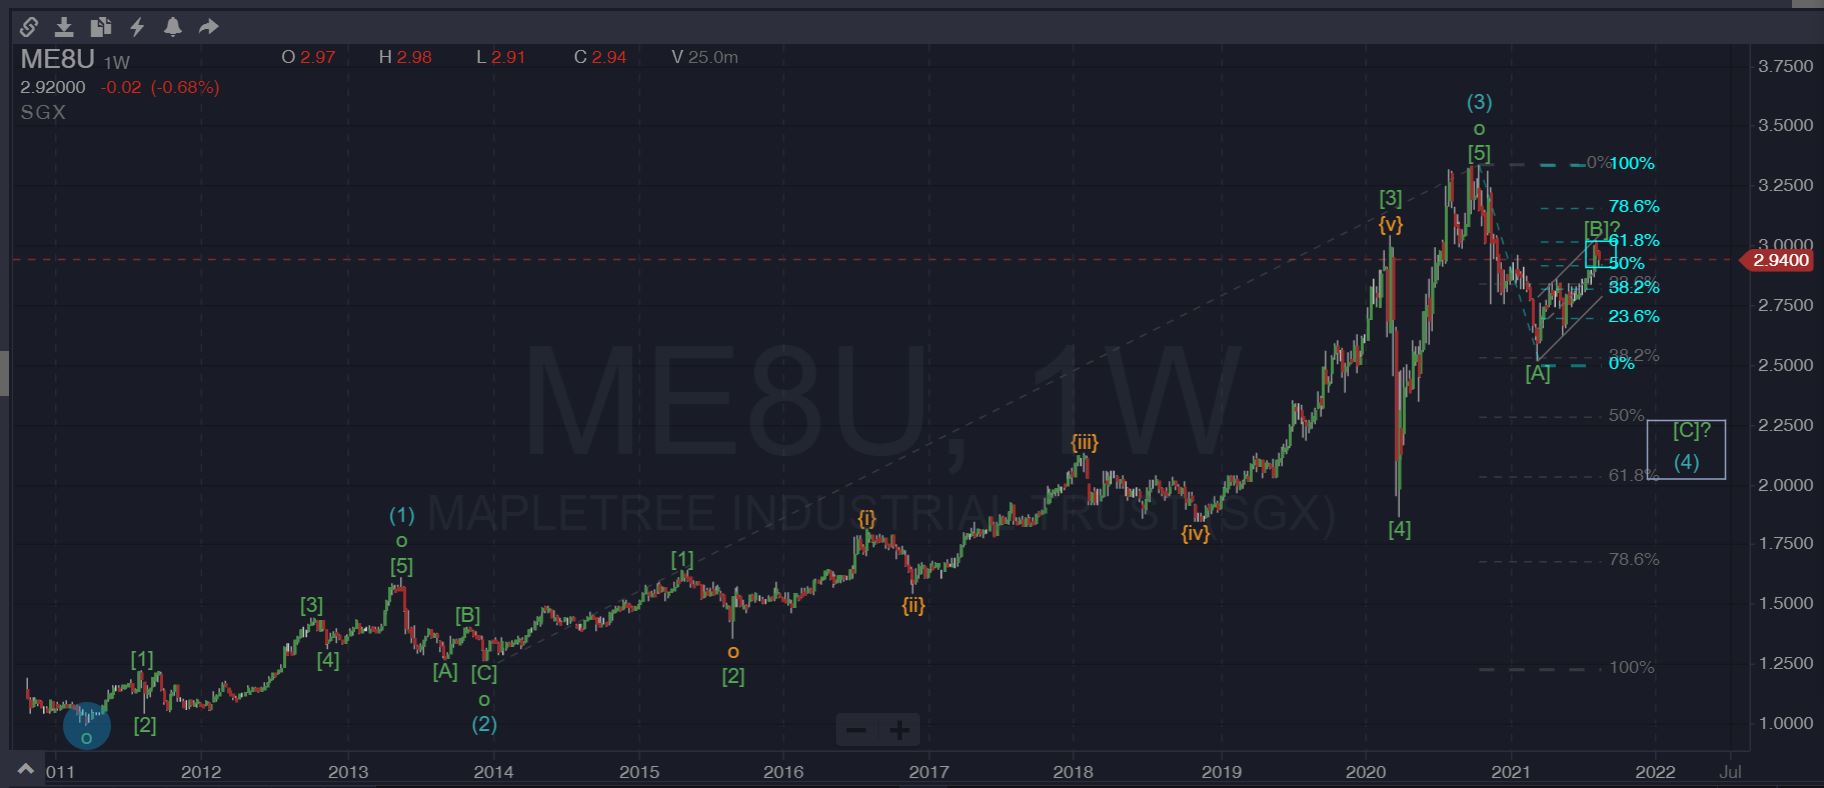
However, I have a slightly different view of the Mapletree Industrial Trust Forecast according to my latest Elliott Wave count.
The ATH on the 12th Oct 2020 looks more like the completion of an extended Wave 3 in Green instead of the completion of the overall Wave 5 of the Primary Cycle.
From the chart above, the extended Wave 3 in Green can be further sub-divided into another 5 Wave sequence highlighted in Orange.
And the current correction is actually a Corrective Wave 4 in Green that has yet to complete.
FORMATION OF A COMPLEX WAVE 4
According to Elliott Wave’s Law Of Alternation, if the Wave 2 Correction is “Shallow”.
Then, the corresponding Wave 4 Correction is likely to be “Deep” and vice versa.
Thus, if this holds true, then we are expecting the Wave 4 in Green to be more complex in the case of our Mapletree Industrial Trust Forecast.
If you examine closely the prior price action that unfolded in the initial “A” or “W” leg drop that began after MIT’s ATH.
One can easily identify the presence of a long tailed candle that looks like an hammer candlestick pattern.
Depending on how you label this spike, we can either count this initial leg down as either an “A” or “W” wave.
Fortunately, no matter how we label it, this does not change the structural direction that it has more downward bias.
Currently, the share price of MIT has retraced higher to the 61.8% region of the first leg down.
If the prior Elliott Wave Count is correct, then we might just have completed the “B” or “X” leg of the ABC or WXY corrective structure respectively.
POTENTIAL FINAL LEG DOWN
From a structural view point, our Mapletree Industrial Trust Forecast seems to be shaping up for a Zig-Zag correction.
This is irregardless of whether it is an ABC or WXY type Zig-Zag correction.
And if this forecast holds up, statistically speaking we are looking for MIT share price to further slide to complete the final leg.
This final leg down could unfold in a 5-wave sequence as either a “C” leg.
Or in a 3-wave sequence into a “Y” leg down.
With a high probability of dropping into the 50% to 61.8 Fibonacci Retracement Zone of the previous Wave 3 in Green.
This Mapletree Industrial Trust Forecast is based on our blog’s Elliott Wave Analysis and is not a trade recommendation.
Please do your own due diligence before trading or investing.
Trade Safe and never risk more than 1% to 2% of your account equity on any trades.
For more potential trade setup suggestions on the Singapore Stock Markets, check our Blog Posts On SG Stocks.
Shorten your learning curve by downloading our complimentary Elliott Wave Cheat Sheets.
For more articles on the Elliott Wave Principle, check out our other posts in our Elliott Wave Blog.