
Contrary to prevailing buoyant market sentiments.
Our blog’s NIO Elliott Wave Analysis has taken a diverging view to most main stream analyst’s opinions.
Being a contrarian trader has always worked well for me in the past.
Sometimes, being able to view the financial markets differently from most traders has its advantages.
Somehow, it has allowed me to better understand how the Big Boys work behind the scenes to manipulate the markets.
And often, the best trading outcomes has always been trades that are able to ride on the coattails of the Big Boys.
CURRENT NIO ELLIOTT WAVE ANALYSIS
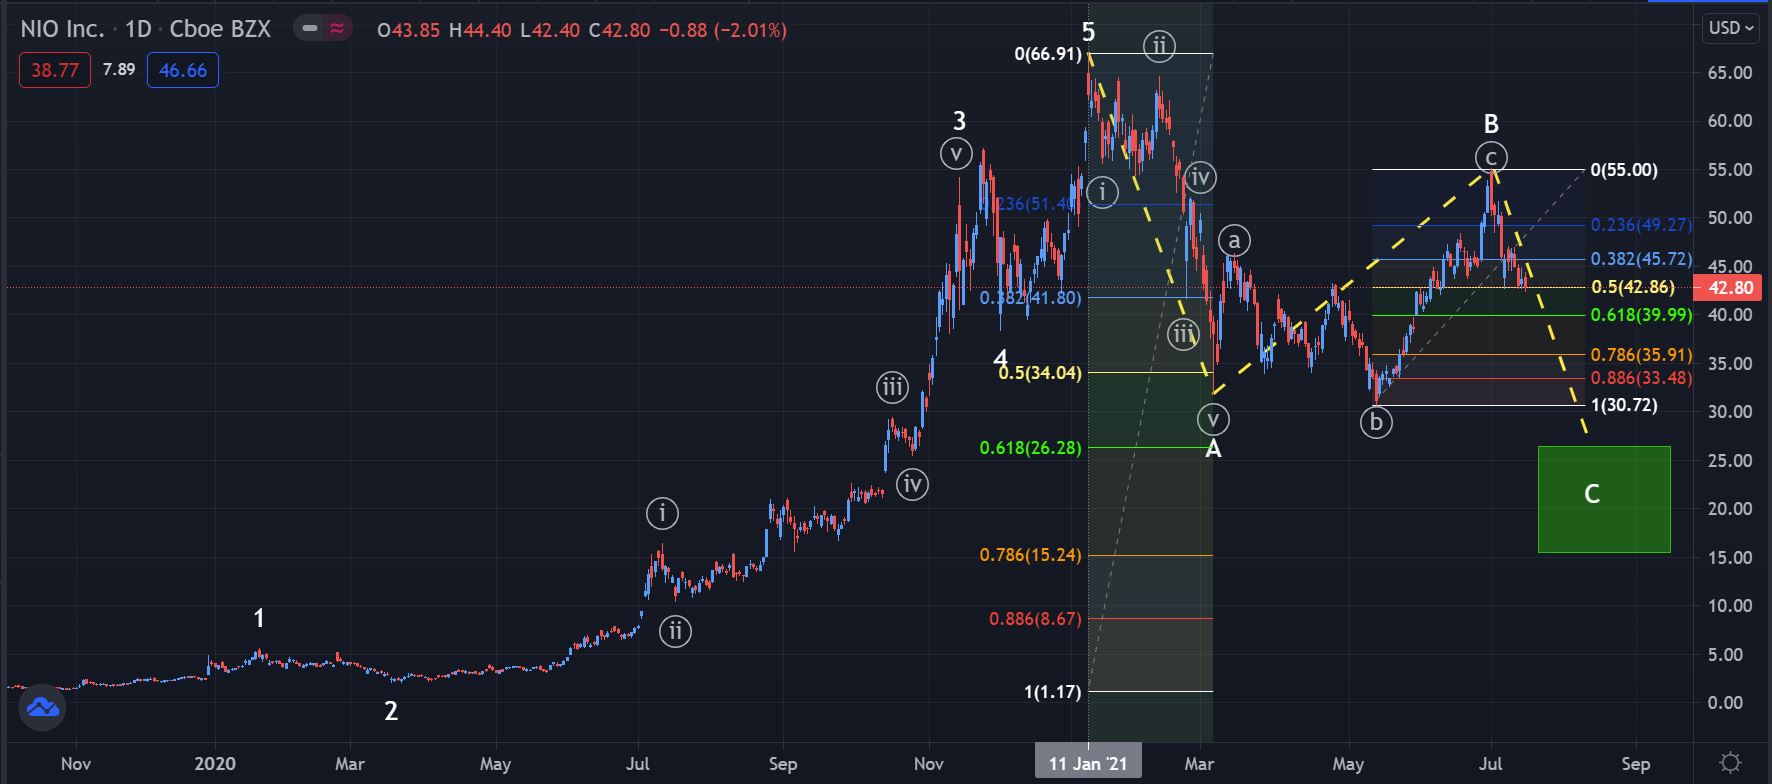
I reckon we can all agree that NIO is clearly in the midst of a major correction.
Especially after its hyperbolic 5 wave move up to its peak at around $67 on the 11th Jan 2021.
The big question on most trader’s mind is whether this correction has really ended?
Statistically speaking, after a massive rally, prices will generally retrace.
Typically, back to the Fibonacci zone of around 50% to 61.8% in a 3 wave corrective move.
And ideally touching base with the Golden Fibonacci level of 61.8% for good measure.
POSSIBILITY OF BOY BOY’S INTERVENTION
Technically, NIO has indeed retraced to just beyond the 50% retracement region.
However, the manner in which the drop panned out can be a bit ambiguous to my liking.
Our NIO Elliott Wave Analysis indicates that this massive drop from 11th Jan 2021 to 13th May 2021 looks more like a 5 wave impulsive sequence rather than a 3 wave corrective sequence.
NIO’s current price action seems to hint that it has all the hallmarks of a possible Big Boy’s intervention.
The next question that comes to mind is that what kind of corrective structure is it really forming if the Big Boys are indeed pulling the strings?
POSSIBLE SCENARIO
According to the Elliott Wave Principle, there are a few different scenarios that could play out for NIO Inc.
In my humble opinion, I am more inclined to go with the extended 5-3-5 A-B-C Zig Zag corrective structure.
Kindly follow the Bright Yellow colored Dashed Zig Zag lines for visual reference.
According to our NIO Elliott Wave Analysis, I view the A-Leg in White as a clear 5 wave sequence dropping to slightly beyond the 50% retracement zone.
The ambiguity arises when we start analyzing the B-Leg in White.
Here, I am viewing the middle leg as a more complex “B” wave corrective structure.
Possibly forming a “Expanded Flat” corrective structure with an extended C-leg in the lower degree.
And in the process, creating a “Bull Trap” to entice all the traders going long.
PLAUSIBLE OUTCOME
Now, if the “Contrarian” view works out, our NIO Elliott Wave Analysis seems to indicate that the impending drop is likely to pan out as a 5 wave sequence.
The C-Leg in White could jolly well drop much lower to retest the Fibonacci 61.8% to 78.6% zone as highlighted by the Green Box.
Personally, I have “witness” similar moves by the Big Boys for hot technology stocks in the past.
That is primarily why I am biased to the downside for NIO going forward.
However, like I always preach, the markets are “Unpredictable”.
Always do your own due diligence before committing to any trade.
Trade Safe and never risk more than 1% to 2% of your account equity on any single trade.
For more potential trade setup suggestions on the US Stock Markets, check our Blog Posts On US Stocks.
Shorten your learning curve by downloading our complimentary Elliott Wave Cheat Sheets.
For more articles on the Elliott Wave Principle, check out our other posts in our Elliott Wave Blog.